
Six Sigma: defined
Six Sigma defined through statistical, business, and academic lenses.

A quality "Marshall plan" has been launched by Motorola Corporation in 1981. The aim of the plan was ten-fold improvement in quality, striving for world-class status. Key initiative of the plan were: six sigma quality, total cycle time reduction, product and manufacturing leadership, profit improvement and participative management (Bhote, 1989).
Aforementioned plan is considered to be the formal inception of Six Sigma.
General Electric’s successful deployment of its Six Sigma programme in the 1990s led to increased interest in the method. Difference between Motorola Corporation’s and General Electric’s deployment was in the focus. In Motorola Corporation Six Sigma was deployed as a continuous improvement programme focused on quality, while General Electric deployed Six Sigma as strategic initiative focused on cost reduction. Both organizations achieved significant return on investment, and both claimed that Six Sigma programme was the reason (Harry, 2005).
Since its inception Six Sigma has been defined in a number of ways:
Six Sigma is a disciplined, data-driven approach and methodology for eliminating defect and reducing variation in any process, from manufacturing to transactional sector and from product to service sector. – Shanmugam (2007)
Six Sigma is rigorous and highly disciplined business process adopted by companies to help focus on developing robust, near-perfect products and services. – Tang et. al (2006)
Six Sigma is a business strategy used to improve business profitability, to improve the effectiveness and efficiency of all operations to meet or exceed customer’s needs and expectations. – Antony and Coronado (2001)
Six Sigma can be defined as a systematic approach for strategic process improvement that relies strongly on statistical tools and scientific method to make reductions in customer-defined defect rates. – Firka (2010)
Six Sigma is a comprehensive and flexible system for achieving, sustaining and maximizing business success. Six Sigma is uniquely driven by close understanding of customer needs, disciplined use of facts, data and statistical analysis, and diligent attention to managing, improving, and reinventing business processes. – Pande (2000)
The Six Sigma method is a project-driven management approach to improve the organization’s products, services, and processes by continually reducing defects in the organization. It is a business strategy that focuses on improving customer requirements understanding, business systems, productivity, and financial performance. – Kwak and Anbari (2006)
Six sigma is a methodology for pursuing continuous improvement in customer satisfaction and profit that goes beyond defect reduction and emphasizes business process improvement in general. – Breyfogle (2003)
From presented definitions of Six Sigma it can be seen that it is perceived as approach, method, system, managerial approach or business process. During the first generation (1987–1994) statistical viewpoint was dominant (Hoerl, 1998; Hahn et al., 1999), while business viewpoint was popularised in the second generation (1994–2000).
Statistical viewpoint
Data sets are statistically described with the mean and measure of variability. There are several ways to depict variability: range, interquartile range, variance, standard deviation and coefficient of variation. In engineering statistics variance and standard deviation are preferred ways of measuring variability since they consider each of the data values from the analyzed data set. Variance is defined as follows (Newbold et al., 2007):
With respect to variance, the population variance, σ², is the sum of the squared difference between each observation and the population mean divided by the Population size, N:
\begin{equation} \label{eq:pop_variance}
\displaystyle\sigma^2=\frac{\displaystyle\sum_{i=1}^N (x_i-\mu)^2}{\displaystyle N}
\end{equation}
The sample variance, $s^2$, is the sum of the squared differences between each observation and the sampe mean divided by the sample size, $n$, minus 1:
\begin{equation} \label{eq:samp_variance}
\displaystyle s^2=\frac{\displaystyle\sum_{i=1}^n (x_i- \bar{x})^2}{\displaystyle n-1}
\end{equation}
Since computation of variance requires squaring the distances, meaning that measurement units are squared as well, square rooting the variance restores measurement units. Standard deviation, the square root of variance, measures the average spread around the mean and is defined as follows (Newbold et al., 2007):
With respect to standard deviation, the population standard deviation, σ, is the (positive) square root of the population variance and is defined as:
\begin{equation} \label{eq:pop_stdev}
\displaystyle\sigma = \displaystyle\sqrt{\sigma^2}=\sqrt{\frac{\displaystyle\sum_{i=1}^N (x_i-\mu)^2}{\displaystyle N}}
\end{equation}
The sample standard deviation, $s$, is:
\begin{equation} \label{eq:samp_stdev}
\displaystyle s= \displaystyle \sqrt{s^2}=\sqrt{\frac{\displaystyle\sum_{i=1}^n (x_i- \bar{x})^2}{\displaystyle n-1}}
\end{equation}
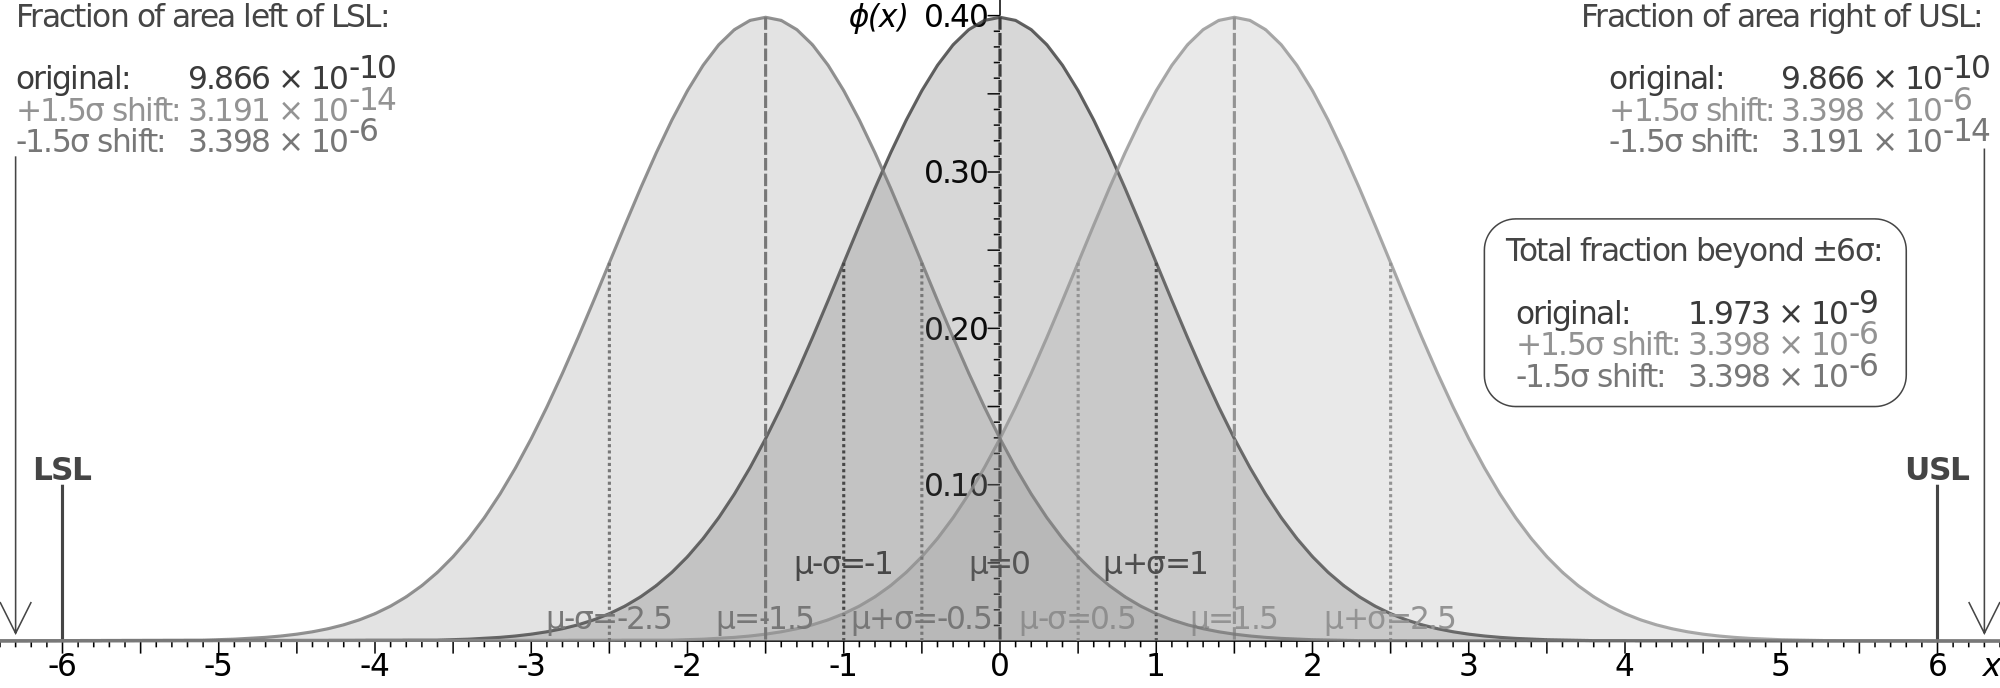
An empirical rule is that almost all observations fall within the $\mu \pm 3\sigma$ interval (Newbold et al., 2007). For a long period of time processes within the $\mu \pm 3\sigma$ interval were considered acceptable (McClusky, 2000). But when quality is measured as defect per million opportunities (DPMO), a processes within the $\mu \pm 3\sigma$ interval yields 2700 DPMO (see table). In the reality, it yields even more DPMO due to the long term dynamic mean variation (Drake et al., 2008). Processes operating within $\mu \pm 6\sigma$ interval yield 0,0002 DPMO, or 3,4 when $1,5\sigma$ shift is taken into consideration. Probability density plot for $\pm6\sigma$ with $1,5\sigma$ shifts is presented in figure below.
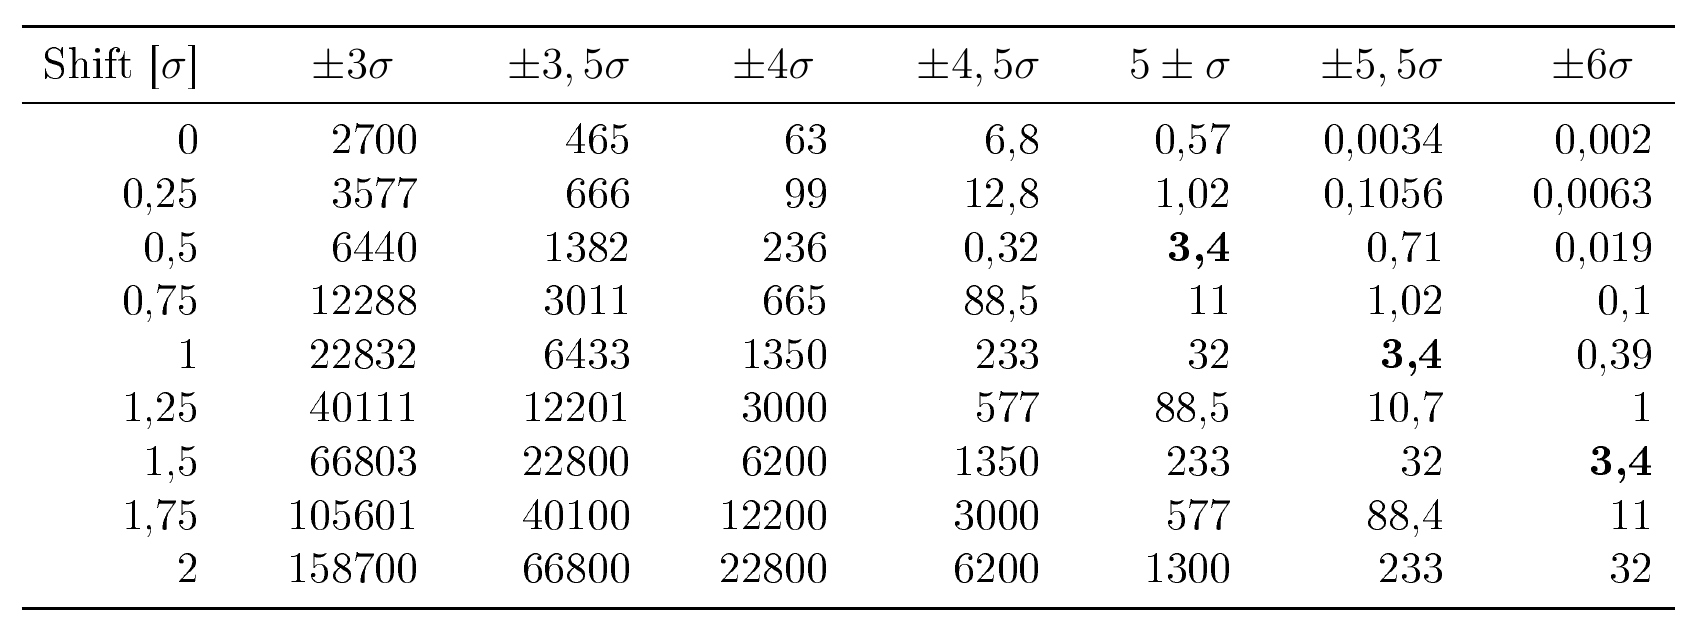
Therefore, when Six Sigma is mentioned in the statistical context, it refers to the process operating within $\pm 6\sigma$ interval with $1,5\sigma$ shift, yielding 3,4 DPMO.
Business viewpoint
Business viewpoint is concisely presented by Antony & Coronado (2001), where authors refers to Six Sigma as a business strategy used to improve business profitability, to improve the effectiveness and efficiency of all operations to meet or exceed customer's needs and expectations. Since Six Sigma put strong emphasis on financial returns of chosen projects, organizations were able to link process improvement with cost savings and increased value (Kwak & Anbari, 2006). Therefore, when Six Sigma is mentioned in the business context, it refers to the business strategy for profitability improvement and customer satisfaction.
Academic definition
Definitions presented at the beginning of this chapter are inadequate for scientific investigation. Aforementioned definitions are dependant on the interpretation of the user. Instead, conceptual definitions should show evidence of inclusivity, exclusivity, differentiability, clarity, communicability, consistency and parsimony (Hempel, 1970). A rigorous base definition is proposed by Schroeder et al. (2008):
Six Sigma is an organized, parallel-meso structure to reduce variation in organizational process by using improvement specialists, a structured method, and performance metric with the aim of achieving strategic objective.
Key elements of proposed definition are: parallel-meso structure, improvement specialists, structured method, and performance metrics.
Parallel-meso structure
Six Sigma team and reporting infrastructure are existent within the organisation, but they operate outside of organisation's normal way of operating. If definition of parallel structures is taken into account (Lawler, 1996), then Six Sigma can be described as parallel structure. Meso theory is defined as follows:
Meso theory concerns the integration of both the micro- and macro-levels of analysis. Individuals and groups affect the organization and the organization in return affect individuals and groups. To thrive in organizations, managers and employees need to understand multiple levels simultaneously. – Daft (2010)
Schroeder et al. (2008), Barney (2002), and Sinha & Van de Ven (2005) linked Six Sigma with meso theory. In Six Sigma multilevel integration is achieved by strategic project selection and leadership engagement. Aforementioned is possible since senior champion is usually from the executive management, and is in position to select project that are strategically aligned with the goals of the organisation.
Improvement specialists
While champions provide holistic view of the organisation, Master Black Belts, Black Belts and Green Belts have functions of improvement specialists.
Structured method
DMAIC (Define - Measure - Analyze - Improve - Check) loop is used as a structured method for process improvement. Although it has been patterned after PDCA, it had more success due to its prescriptive nature.
Performance metrics
Six Sigma performance metrics can be categorised as customer oriented (CTQ for example) and financial metrics. Goals based on aforementioned metrics result in specific and challenging goals that can lead to higher level of performance.
Concluding remarks
In this article I went over various definitions of Six Sigma, covering statistical, business, and an academic viewpoints. Following articles will deal with practical issues like Six Sigma deployment, methods, and organisation.
References
Antony, J., & Coronado, R. (2001). A strategy for survival. Manufacturing Engineer, 80(3), 119–121.
Barney, M. (2002). Macro, meso, micro: Six Sigma. The Industrial-Organizational Psychologist, 39(4), 104–107.
Bhote, K. R. (1989). Motorola’s long march to the Malcolm Baldrige National Quality Award. National Productivity Review (1986-1998), 8(4), 365–365.
Breyfogle, F. (2003). Implementing Six Sigma: Smarter solutions using statistical methods (2nd ed.). Wiley.
Daft, R. (2010). Organization theory and design (10th ed.). South-Western Cengage Learning.
Drake, D., Sutterfield, J., & Ngassam, C. (2008). The revolution of six-sigma: An analysis of its theory and application. Academy of Information and Management Sciences Journal, 11(1), 29.
Evans, J. (2005). An introduction to Six Sigma & process improvement. Thomson/South-Western.
Firka, D. (2010). Six Sigma: An evolutionary analysis through case studies. TQM Journal, 22(4), 423–434.
Hahn, G. J., Hill, W. J., Hoerl, R. W., & Zinkgraf, S. A. (1999). The impact of Six Sigma improvement—A glimpse into the future of statistics. The American Statistician, 53(3), 208–215.
Harry, M. (2005). Six Sigma the breakthrough management strategy revolutionizing the world’s top corporations. Currency Book/Doubleday.
Hempel, C. (1970). Methods of concept formation in science. Formations of the Unity of Science. University of Chicago Press, Chicago, IL.
Hoerl, R. W. (1998). Six Sigma and the future of the quality profession. IEEE Engineering Management Review, 26, 87–94.
Kwak, Y. H., & Anbari, F. T. (2006). Benefits, obstacles, and future of Six Sigma approach. Technovation, 26(5–6), 708–715.
Lawler, E. (1996). From the ground up: Six principles for creating the new logic corporation.
McClusky, R. (2000). The rise, fall and revival of Six Sigma quality. Measuring Business Excellence, 4(2).
Newbold, P., Carlson, W. L., & Thorne, B. (2007). Statistics for business and economics (6th ed.). Pearson Prentice Hall.
Pande, P. (2000). The Six Sigma way: How GE, Motorola, and other top companies are honing their performance. McGraw-Hill.
Schroeder, R. G., Linderman, K., Liedtke, C., & Choo, A. S. (2008). Six Sigma: Definition and underlying theory. Journal of Operations Management, 26(4), 536–554.
Shanmugam, V. (2007). Six Sigma cup: Establishing ground rules for successful Six Sigma deployment. Total Quality Management & Business Excellence, 18(1–2), 77–82.
Sinha, K. K., & Van de Ven, A. H. (2005). Designing work within and between organizations. Organization Science, 16(4), 389–408.
Tang, L. C., Go, T. N., Yam, H. S., & Yoap, T. (2006). Six Sigma: Advanced tools for black belts and master black belts. Wiley.
Wikipedia. (2012). https://en.wikipedia.org/wiki/Six_sigma
This article is a part of Six Sigma series:
 Bruno Pešec
 Bruno Pešec
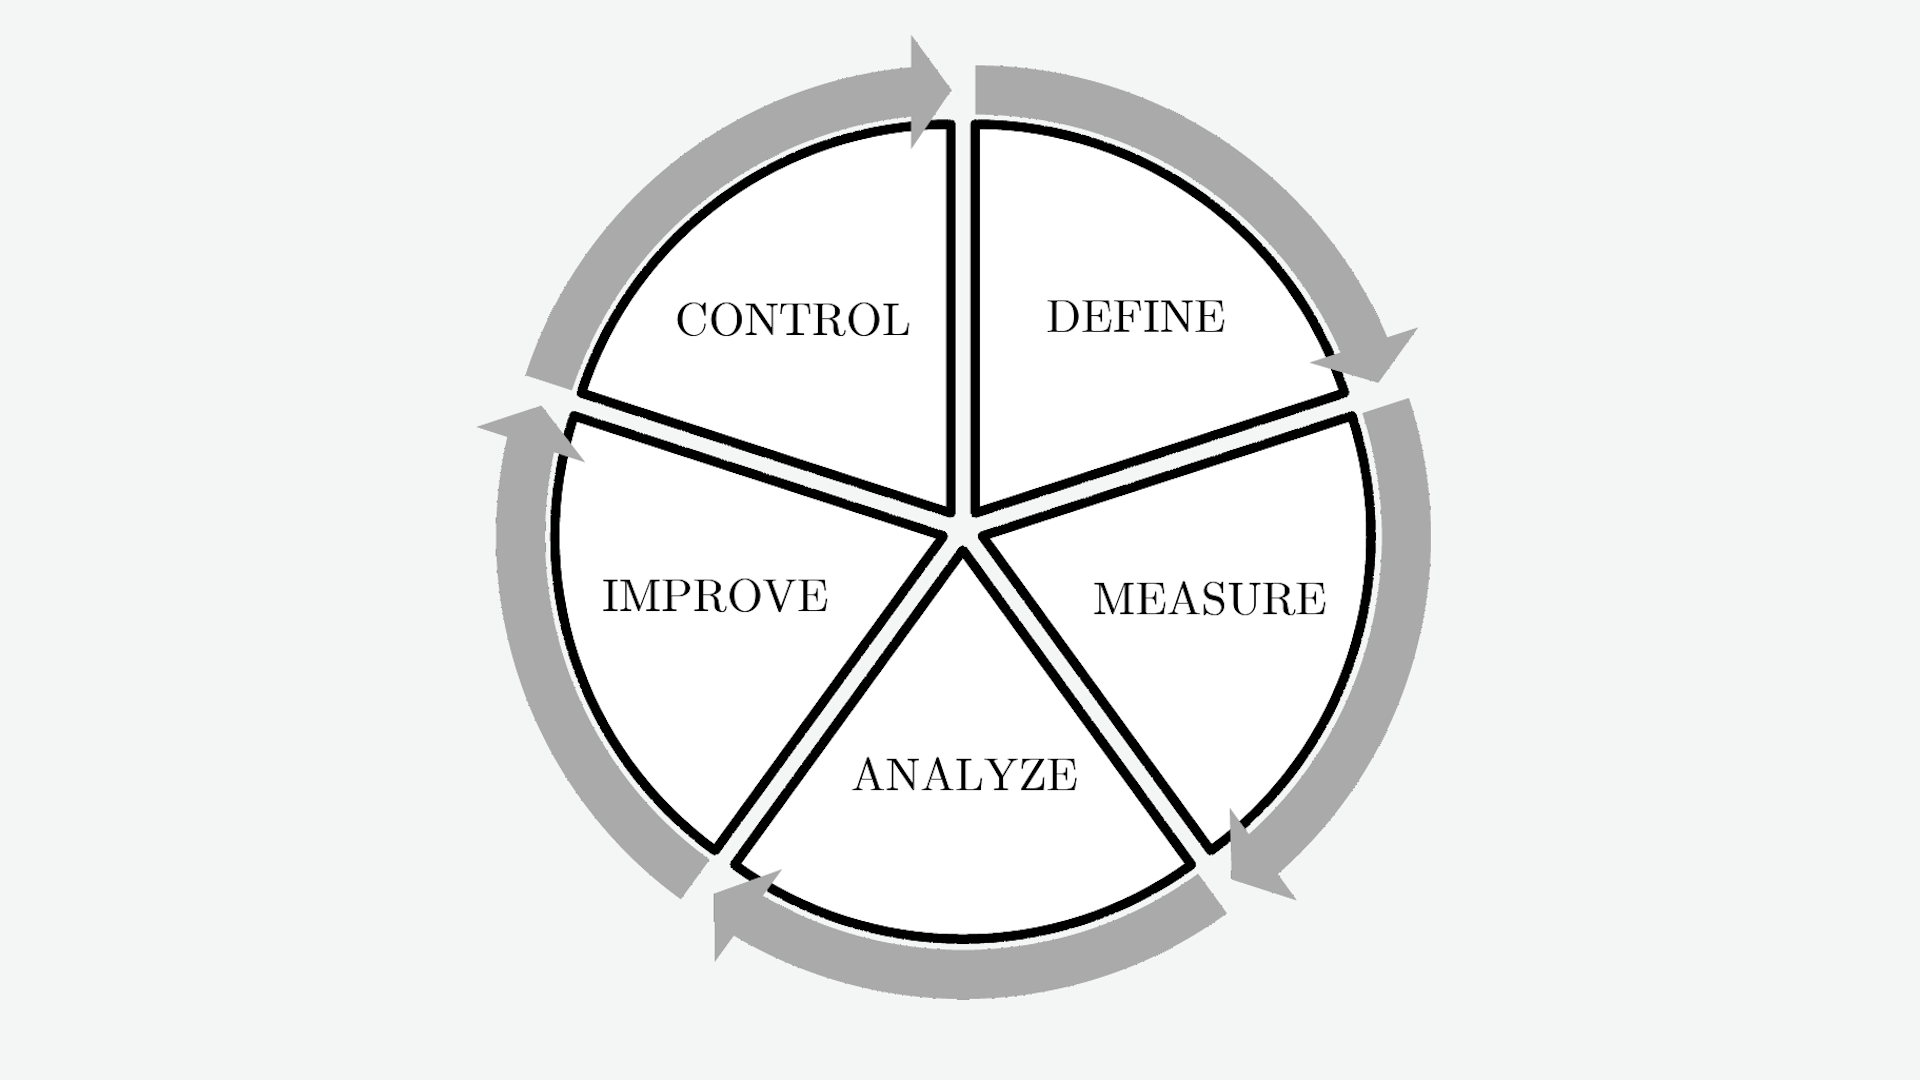 Bruno Pešec
 Bruno Pešec

Bruno Unfiltered
Subscribe to get the latest posts delivered right to your inbox. No spam. Only Bruno.

