
With eyes wide open
How can you use visualisations to ask better questions?

Visualising things help us see things and patterns we would've otherwise missed. It also helps us to communicate and question differently.
In Brain Rules John Medina goes to the extreme, claiming that vision trumps all other senses. He argues that we learn and remember best through pictures, not through written or spoken words.
I see visual mediums as complimentary – instead of superior – to how we understand and communicate. Extended ways of knowing from John Heron and Peter Reason is a useful framework here.
How about some examples?
Visualising data
In the world of quality there is something called Seven basic tools of quality.
Kaoru Ishikawa lists Pareto chart, cause and effect diagram, stratification, check sheet, histogram, scatter diagram, and graph and control chart in What is total quality control? The Japanese way. The only non-visual tool is stratification.
Don't be afraid to use those tools – they are very useful.
For example, let's say a team is looking into improving their revenue numbers. They have a digital product, which is primarily sold through the website. A fair assumption would be if we can bring more traffic to our sales page the revenue numbers would go up.
Now, instead of jumping to solution and spending money on advertising to bring more traffic to the website, this team decides to look at the numbers.
They go into their web analytics and download number of sessions and visits per month. They also download their sales data by month and by product.
First question they ask is are number of website sessions and sales correlated?
Here is what the data says back:
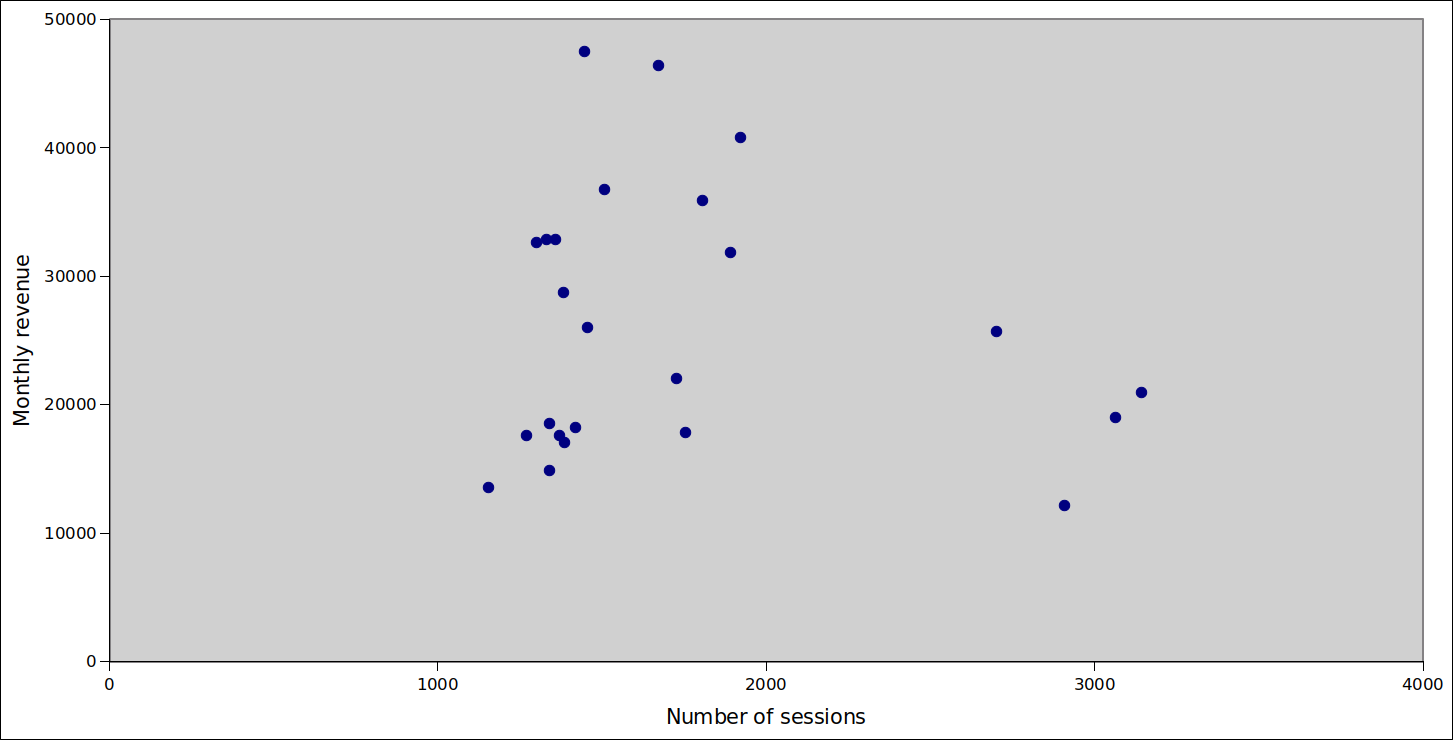
What do you see here? What would you answer? How would you proceed?
First thing the team notices is that there seems to be no correlation between number of sessions and monthly revenue.
Second, they become curious about outliers: three dots on the top with the highest revenue, and three dots on the right with the highest sessions.
Third, they start asking how could they better understand the quality of their sessions.
By visualising their data, the team was able to start asking better questions. They used a mix of quantitative and qualitative inquiry to understand what, why and how was happening. In the end they succeeded improving their monthly revenue.
Visualising inquiry
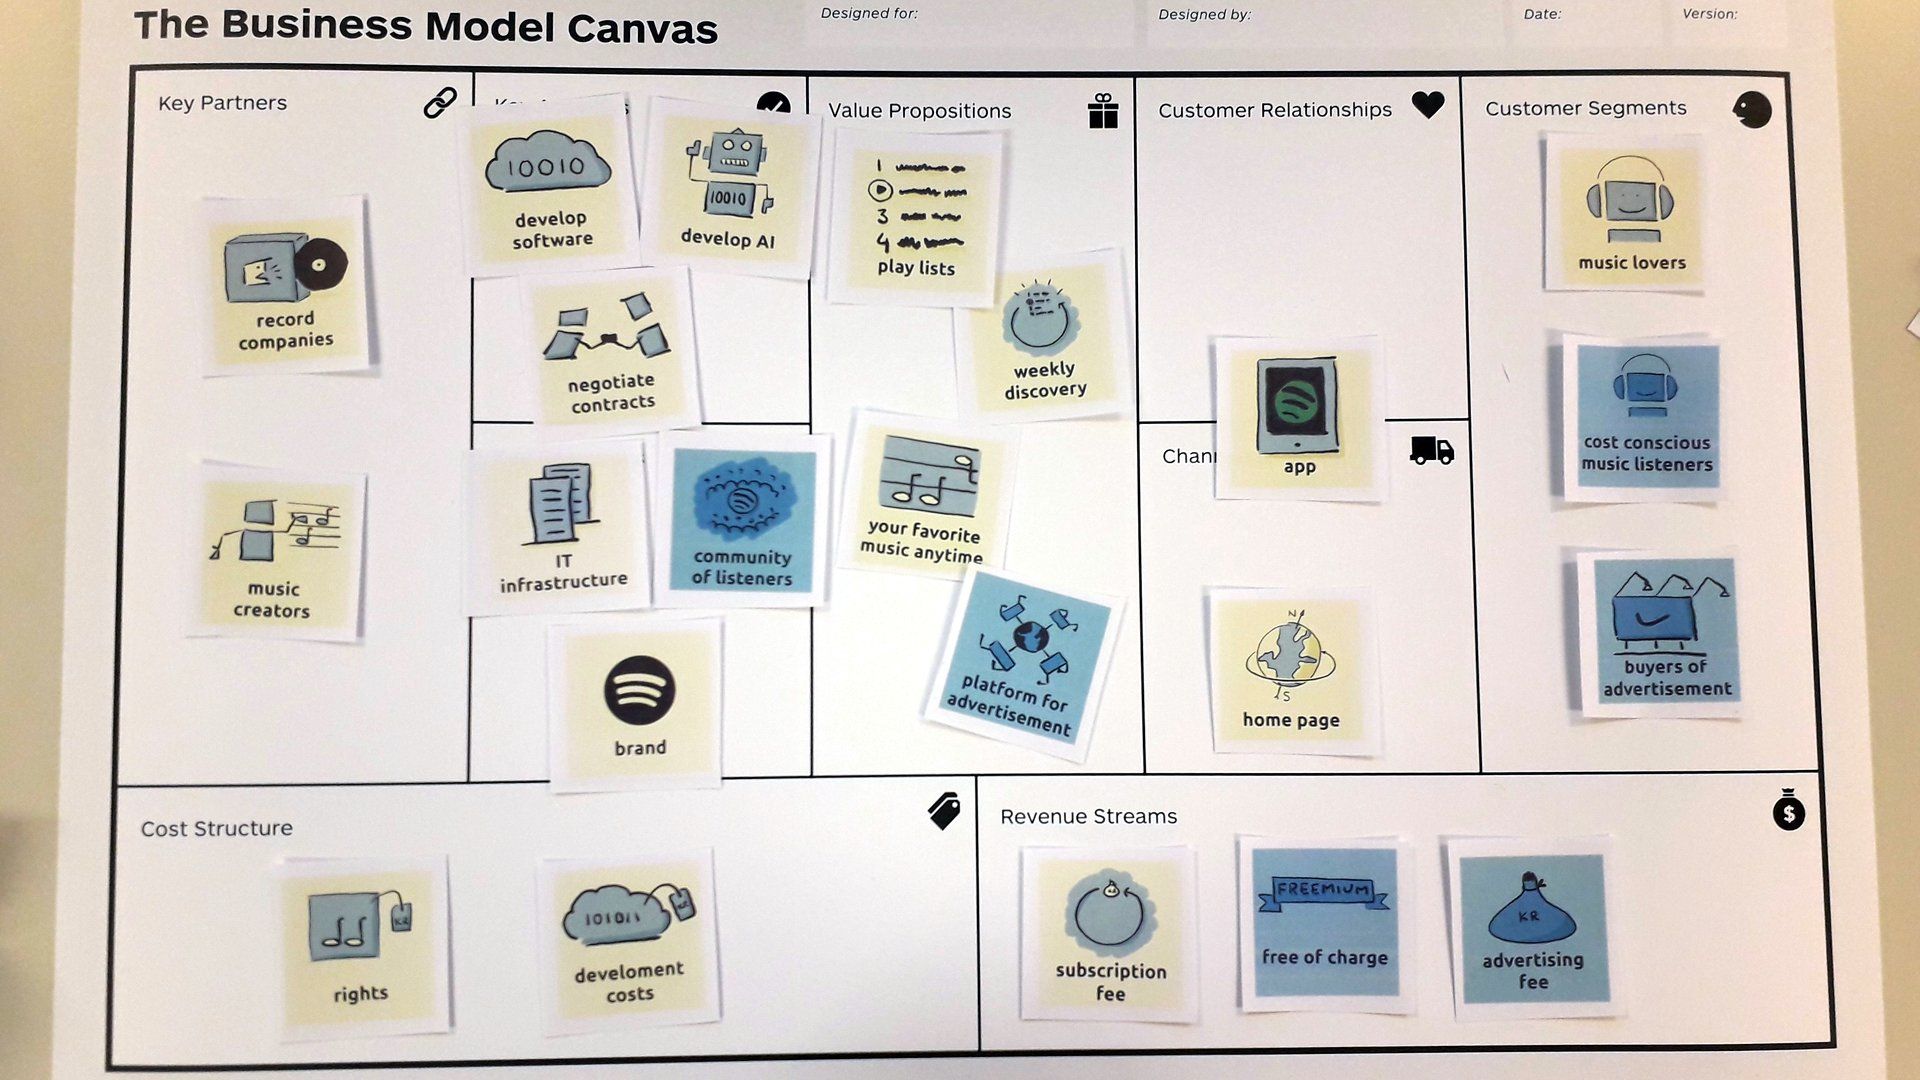
Yves Pigneur often says that elements of a good visual inquiry tool are a conceptual model (ontology), shared visualisation (empty problem spaces), and directions for use (great UX).
Here is an example of visual inquiry using Business Model Canvas to illustrate Shopfiy's business model (blocks by Lauris Muzikants):
I've written a number of articles on using specific tools for visual inquiry:
- Visual tools for understanding customers
- Visual tools for experimentation and innovation accounting
- Bruno’s favourite canvases for strategy, experimentation, and customer experience
- How to prioritise insight rapidly?
- The Business Model Canvas Explained
- Making the most out of the Value Proposition Canvas
By visualising our questions we are able to gain a new look into the problems and issues we are trying to influence. That in turn gives us a possibility to express and get to know differently, potentially discovering new patterns and solutions in the process.
Visualising everything
I focused on two examples of how visualisation can help.
There are many other ways as well, for example visual controls, at-glance checks, infographics, instructionals, pictograms...
Don't stress with your ability to visualise, just start. It is not about being the best artist, but about seeing things you otherwise wouldn't have.

Bruno Unfiltered
Subscribe to get the latest posts delivered right to your inbox. No spam. Only Bruno.


