
Visual tools for experimentation and innovation accounting
Three proven tools for visual overview of experiments, understanding progress, and innovation accounting.
Corporate innovators should obsesses about (1) creating customer value, and (2) creating reusable knowledge.
Customer development, design thinking, and lean startup are great methodologies to achieve the former, while experiment design and innovation accounting are great to achieve the latter.
I've written an extensive step-by-step guide for designing Lean Experiments. If you are doing it right, then you understand that you should continuously learn and experiment.
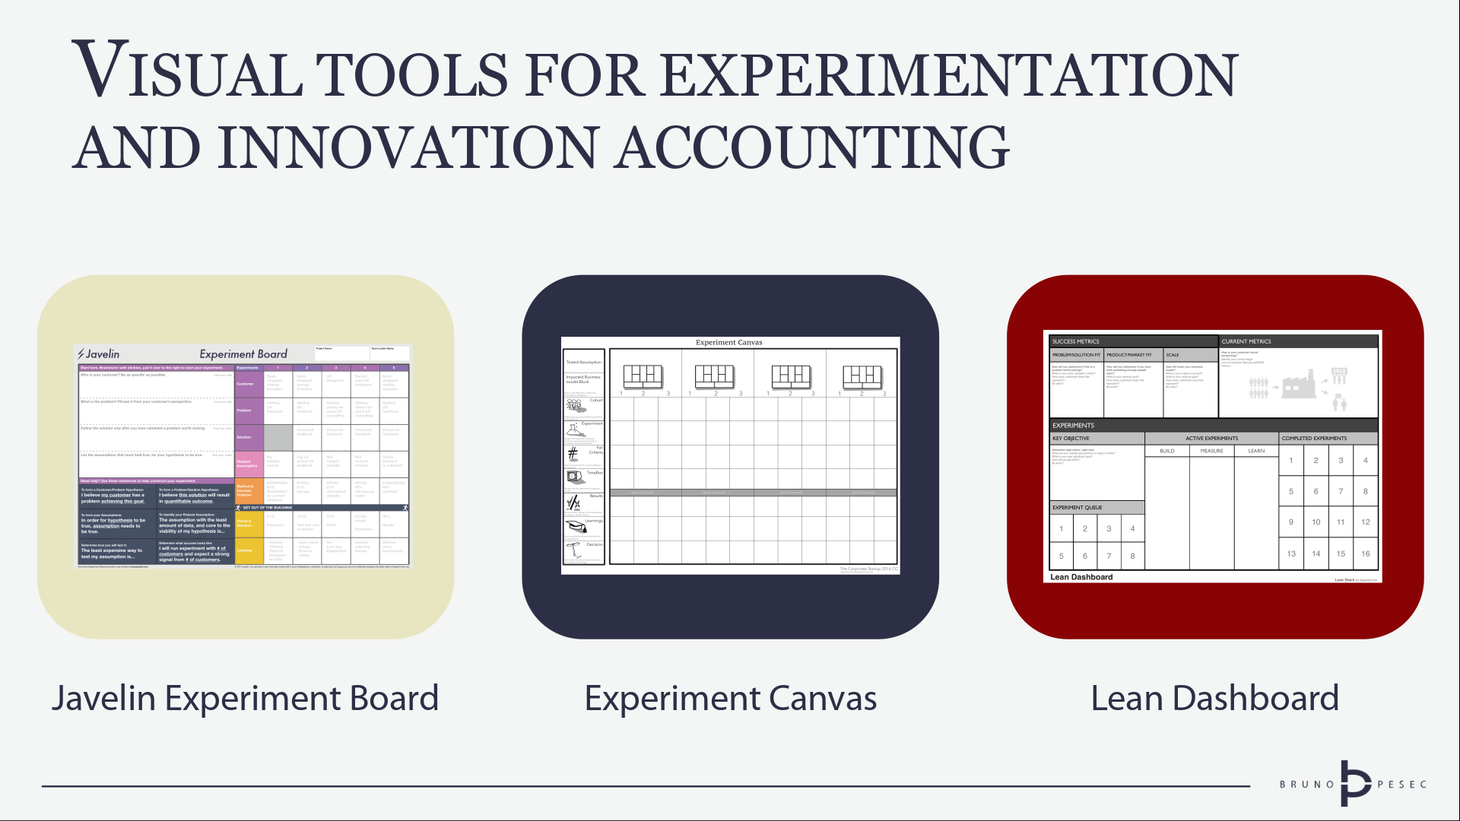
This post is about three proven tools you can use to have a visual overview of your experiments, an understanding of your progress, and to help you with innovation accounting.
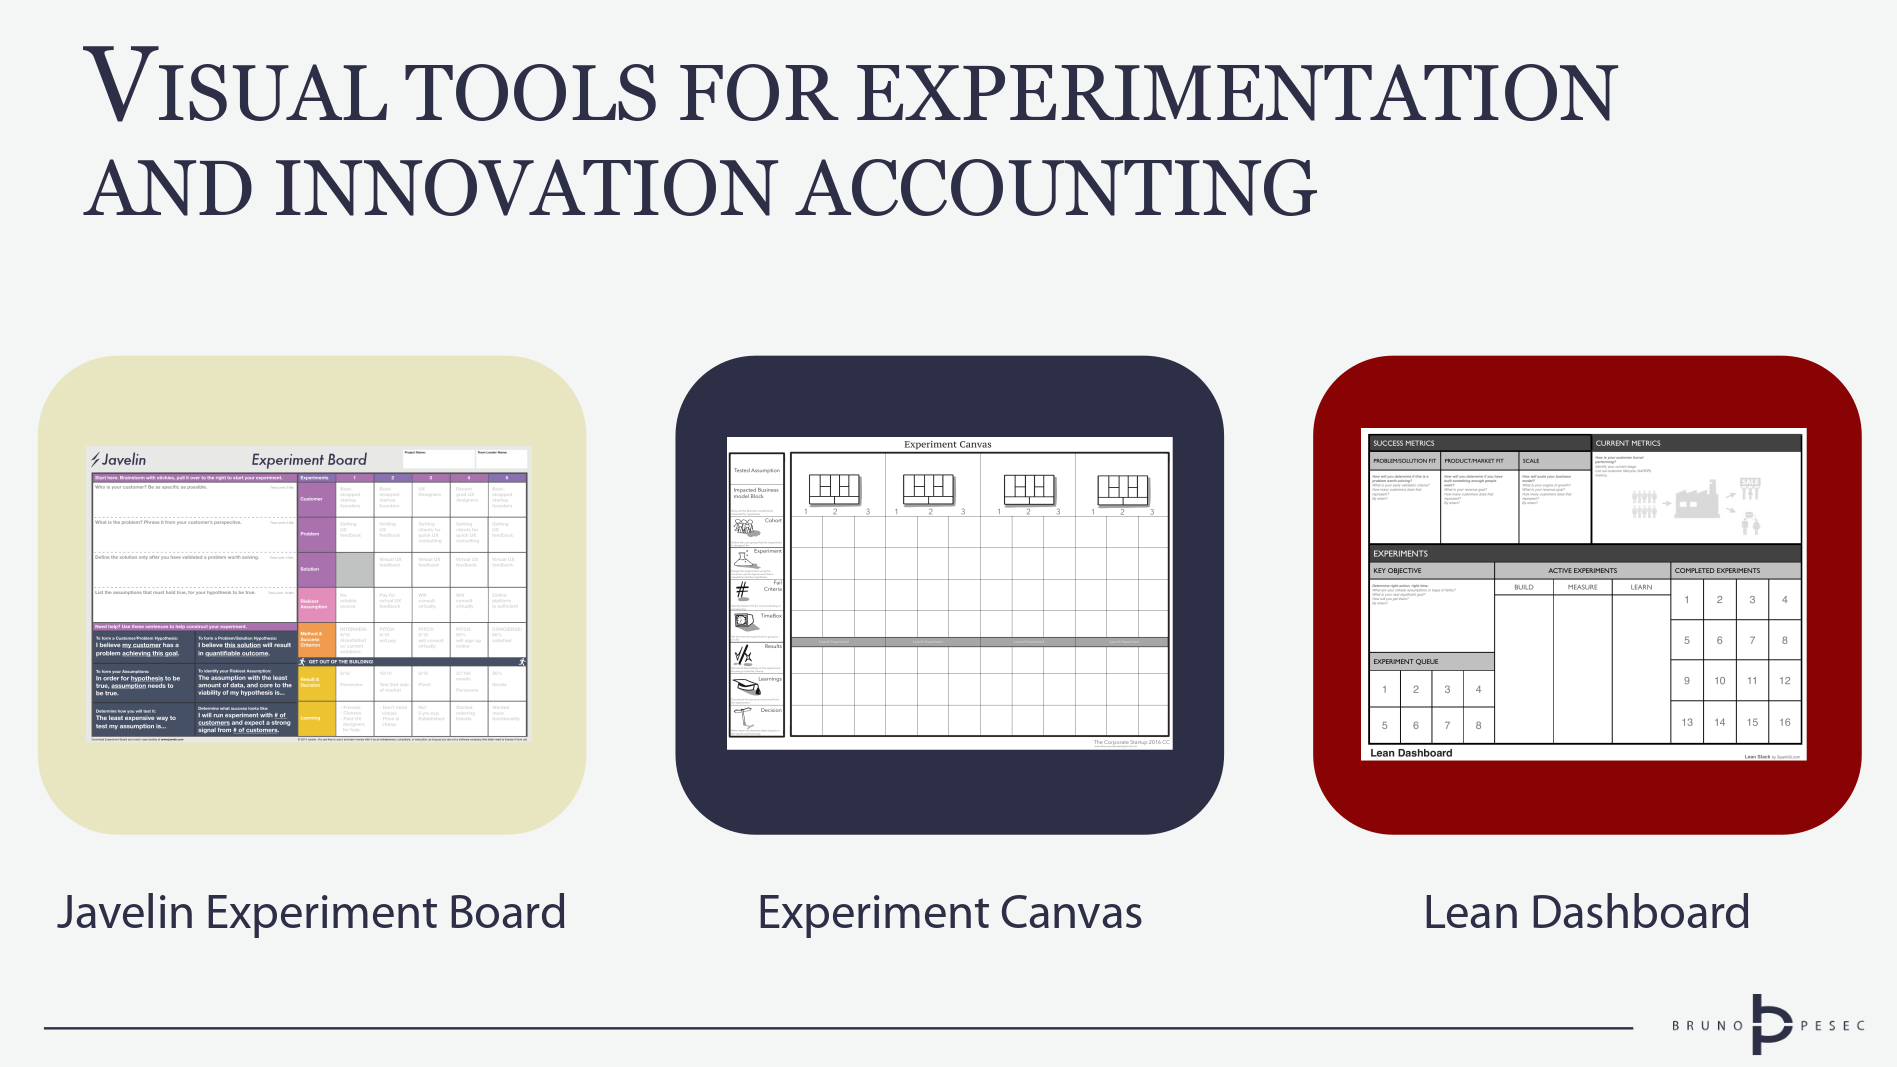
They are:
- Javelin Experiment Board by Trevor Owens and Grace Ng,
- Experiment Canvas by Dan Toma, Tendayi Viki, and Esther Gons, and
- Lean Dashboard by Ash Maurya.
You will benefit most from these tools if you already have an understanding of Lean Startup basics. Two posts that can get you up to speed are:
I cover each from the perspective of when and how to use it.
Javelin Experiment Board
By Trevor Owens and Grace Ng. Download here.

Created through hundreds of Lean Startup Machine workshops worldwide, an early iteration of this board was possibly the first visual tool for managing lean startup style of experiments.
When to use
Javelin Experiment Board was designed and tweaked to support high-speed learning during the very early stage of the idea. It emphasizes learning about customers, and their problem(s).
Due to its origin it is well suited for beginners and situations when you just care about checking if there is a problem-solution fit for the idea at hand.
Consider using the Javelin Experiment Board if:
- you want to explore if there is a match between customers and your idea for two weeks or less,
- you are running some variant of Google Design Sprint,
- you are running a two day event like hackathon or ideathon, or
- you are a team that's still trying to figure out this whole experimentation thing.
How to use
Download the board and study it. There isn't that much to read, but it's all relevant.
Left side of the board is for ideation, right side for experimentation.
Instructions are written on the left side, while examples are in light gray text on the right side.
First experiment should be without solution, as you should be looking for customer-problem fit. No need for solution if those two don't match.
Tutorial video by Grace covers everything you need to get you started. Watch it with the team and get to it.
She also wrote an article for the Lean Enterprise Institute, which is not a mandatory read, but does provide a little bit more insight into thinking behind the board. It also includes a bit of selling, but hey, that's what entrepreneurs do.
Experiment Canvas
By Dan Toma, Tendayi Viki, and Esther Gons. Download here.
When to use
Experiment Canvas from the Corporate Startup (pp. 172-174), acts both as a tool for managing the experiments, but also as an innovation accounting tool for tracking progress and reporting (hopefully, learning) KPIs.
It is a good fit for teams that understand and appreciate the value of experimentation, and are looking to integrate it into their regular practice.
Prior to using it, you should have described your idea using business model canvas, and identified riskiest assumptions in it.
How to use
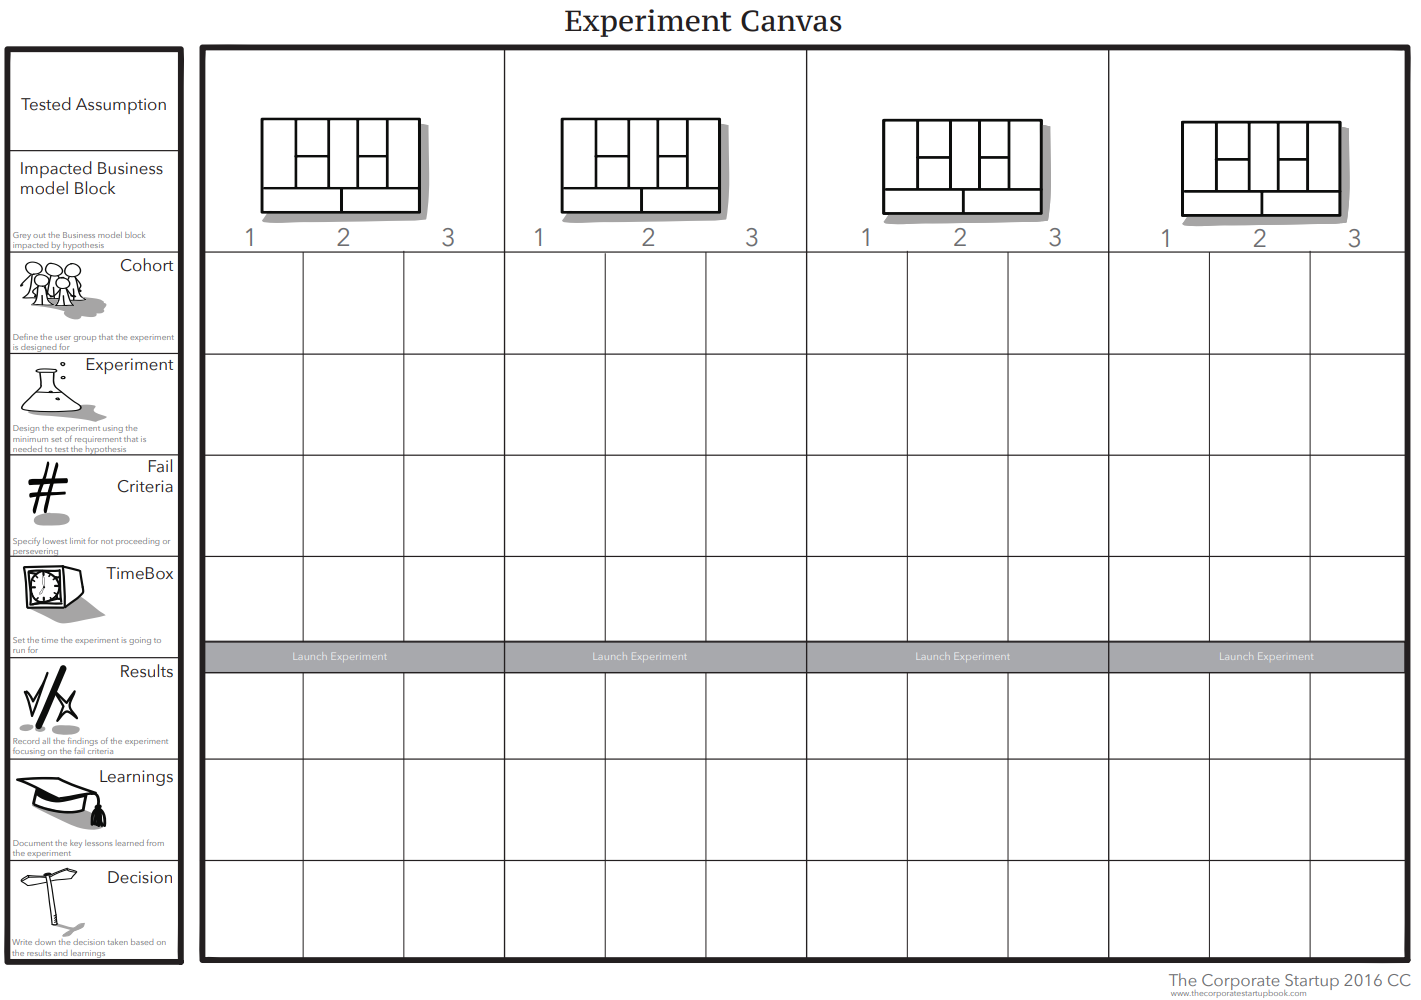
The experiment canvas has four major vertical slices (four illustrations of business model canvas).
Each of them has three minor vertical slices (numbers one to three under the canvas illustration).
Each minor vertical slice represents a single experiment.
That means that, in theory, you can work on four broad assumptions in parallel. Unless you are confident in your experimentation skills, that's a bad idea.
There are nine horizontal lanes:
- test assumption,
- impacted business model block,
- cohort,
- experiment,
- success criteria,
- time box,
- result,
- learnings, and
- decision.
1-6 must be defined before the experiment is executed, while 7-9 are used to record the experiment outcome. Dan wrote a short guide, explaining each block.
My suggestion is that you learn how to design Lean Experiments before you try to use this canvas. That way you'll be able to get the most out of it.
Lean Dashboard
By Ash Maurya. Download here.
This is an interesting one.
I haven't seen a lot of them in the wild, and I'm not sure if Ash still uses it. He usually writes about his tools, but I couldn't any post on the dashboard. There is one that mentions it as a new addition to his walled garden.
Still, I've experienced that it can be a powerful tool in the right hands.
When to use
Lean Dashboard really shines in the hands of experienced teams, who are familiar with the jargon, understand different stages of innovation and product lifecycle, pirate metrics, experiment design, lean startup, and agile work practices.
Alternatively, teams that have access to internal or external coach can benefit from it as well.
How to use
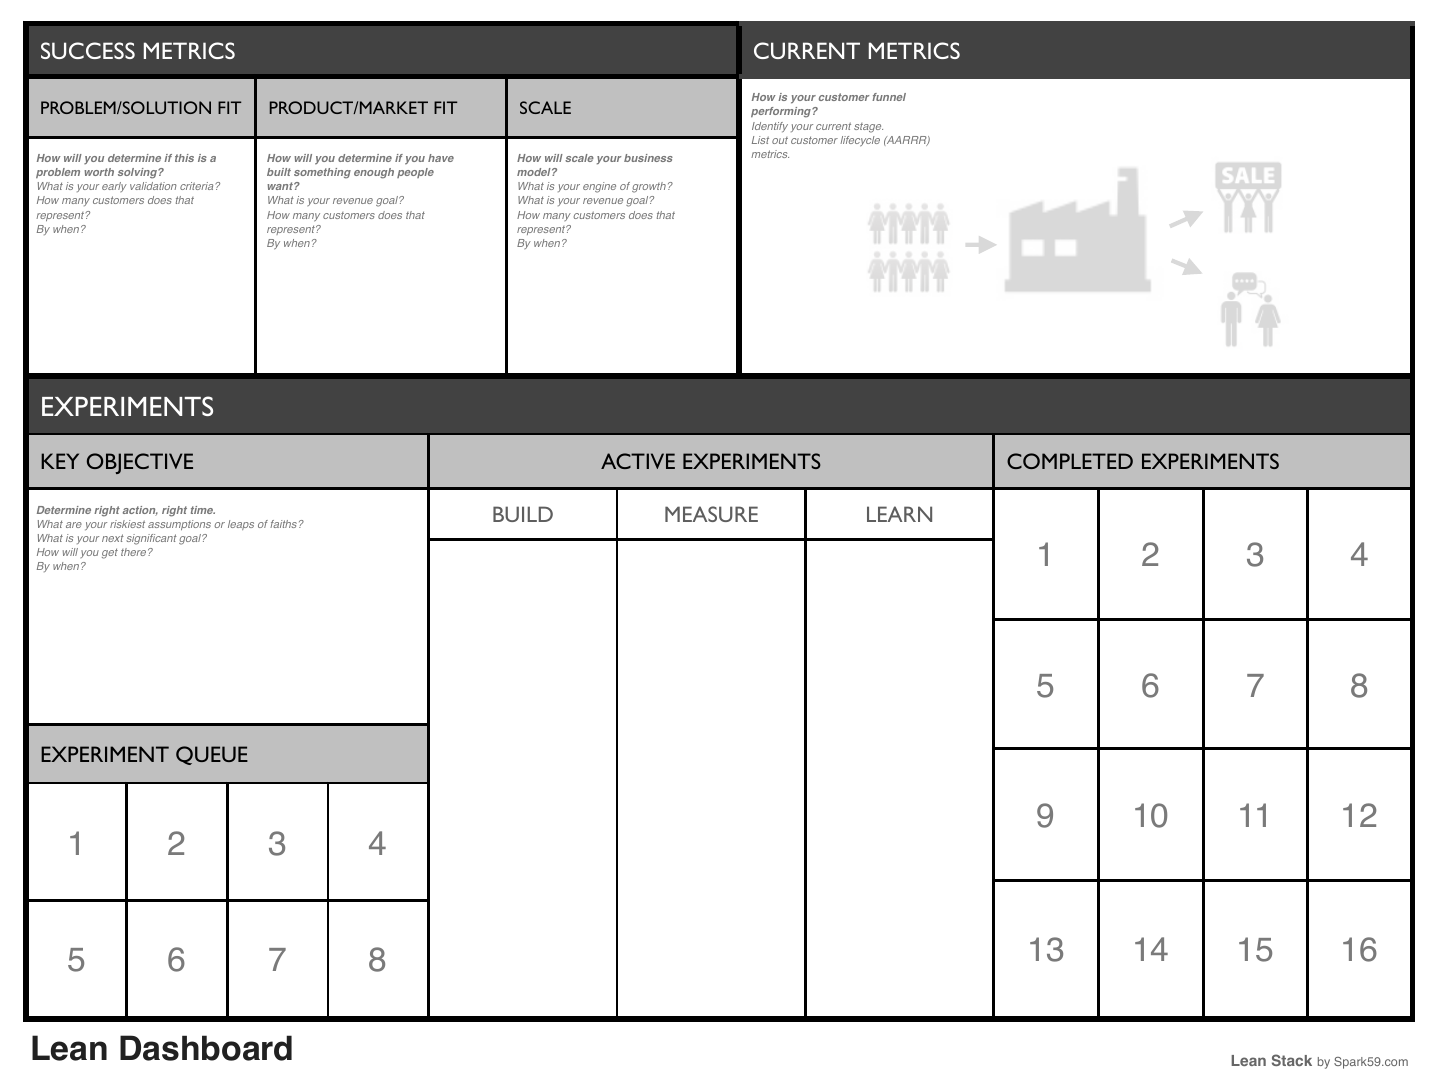
Conceptually, left side of the Lean Dashboard visualises expected outcomes, while right side visualises actual outcomes.
Success metrics are defined for three stages: problem-solution fit, product-market fit, and scale. Metrics should be defined by working backwards, starting with scale and then working out what numbers could precede it.
Key objective should represent the current focus of the team. It can be a specific result, and assumption, a learning goal, etc. It should be changed regularly.
Experiment queue shows all experiments that are waiting to be executed.
Their status is depicted by the Build - Measure - Learn lanes. Building is developing experiments, Measure is conducting the experiments and capturing results, and Learn is interpreting the results.
Once the results are interpreted they are moved to completed experiments.
Current metrics visualise the reality, grounded in the learning from the experiments. Illustration hints at using customer factory (pirate metrics combined with theory of constraints).
Ash talks about Lean Dashboard in his book announcement (from 32nd minute). There is also presentation (slides 104-227), from the Lean Startup Conference, with the same example as in the video.
Closing remarks
The purpose of these visual tools is to visualise progress, help teams surface problems, and to assist them in innovation accounting for their specific team and idea.
And while it might be alluring to jump to the fanciest of tools, that seems to have all the bells and whistles, I caution against that.
When coaching innovation teams, I select the right tool for their maturity level, not what I, or they, like the most. It might be one of the three I described here, or it might be something I create just for that team.
Starting with small, simple steps, building competency day by day, experiment by experiment, will open your eyes to new possibilities.
After a few uses you might feel the urge to change and tweak tools. Fight it. Ask yourself – have I tried it a thousand times? If not, then maybe you are the problem, not the tool.
Once you have gained sufficient experience you can start creating your own customised templates and systems. And you should.
Just remember that whatever you come up with has to be:
- fit for purpose,
- easy and simple to use,
- accessible to whole team,
- visual,
- easy to document, and
- easy to share.
Last point is important for creating reusable knowledge.
Make sure that knowledge you create is available outside the team as well.
That can be a powerful source of competitive advantage.

Bruno Unfiltered
Subscribe to get the latest posts delivered right to your inbox. No spam. Only Bruno.


