Lean Thinking: assessing leanness
How can we measure process cycle efficiency, overall equipment effectiveness, and organisational leanness?

Leanness has been defined as the state of the organisation's transformation to lean thinking. Therefore, prior to assessing the leanness of the organisation or supply chain it is required to establish universal metrics.
Two most common metric in lean thinking are process cycle efficiency and overall equipment effectiveness (OEE) (George, 2002; Basu, 2009; Gibbons & Burgess, 2010).
Efficiency is defined as meeting exact customer requirements with the minimum amount of resources, while effectiveness is defined as capability to produce a desired result, irrespective of efficiency (Hill, 2012).
Process cycle efficiency
Process cycle efficiency is calculated by dividing the amount of value-added time with the total lead time (George, 2002). Synonymous terms are: value added ratio, throughput ratio and manufacturing cycle effectiveness (Hill, 2012).
Mathematically, process cycle efficiency can be expressed as follows:
\begin{equation}
\text{Process Cycle Efficiency} = \frac{\text{Value-Added Time}}{\text{Total Lead Time}}
\end{equation}
Value-added time is the length of CVA activities, while total lead time is how long the process takes from beginning to the end. Comparison of typical and world-class cycle efficiencies is presented following table (George, 2002):
| Application | Typical cycle efficiency | World-class cycle efficiency |
|---|---|---|
| Machining | 1 % | 20 % |
| Fabrication | 10 % | 25 % |
| Assembly | 15 % | 35 % |
| Continuous manufacturing | 30 % | 80 % |
Due to Little's law (Little, 1961; Little, 2011) cycle time can be connected to inventory turnover (Schonberger, 2011; Schonberger, 2011a), enabling monetary assessment (Hofer et al., 2012).
Overall equipment effectiveness
Overall equipment effectiveness (OEE) is an index of measuring the delivered performance of pant or equipment based on good output (Basu, 2009). It is mathematically defined as follows (Hill, 2012; Gibbons & Burgess, 2010):
\begin{equation}
\text{OEE} = \text{Availability} \times \text{Performance} \times \text{Quality}
\end{equation}
Figure below depicts equipment time analysis:
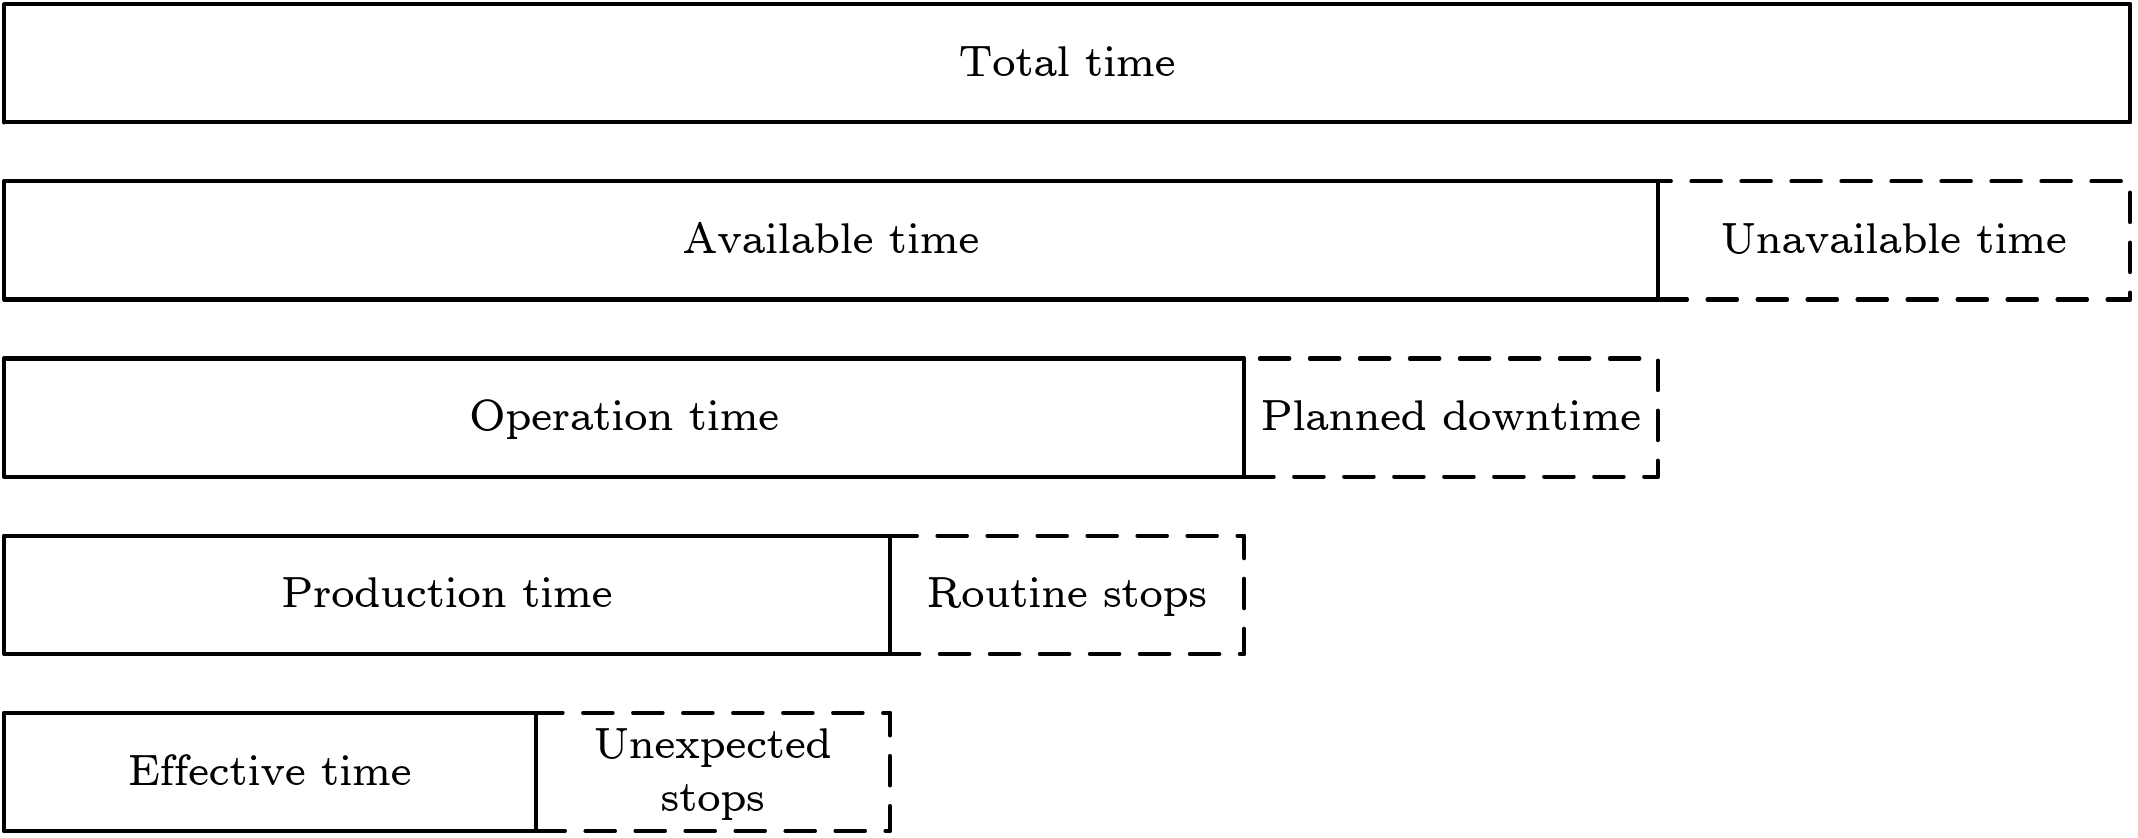
It can be reasoned that effective time and unexpected stops equal production time, production time and routine stops equal operation time, operation time and planned downtimes equal available time, and available time and unavailable time equal total equipment time.
Based on that availability, performance and quality from OEE equation can be calculated as follows:
\begin{equation}
\text{Availability} = \dfrac{\text{Operation time}}{\text{Available time}}
\end{equation}
\begin{equation}
\text{Performance} = \dfrac{\text{Production time}}{\text{Operation time}}
\end{equation}
\begin{equation}
\text{Quality} = \dfrac{\text{Effective time}}{\text{Production time}}
\end{equation}
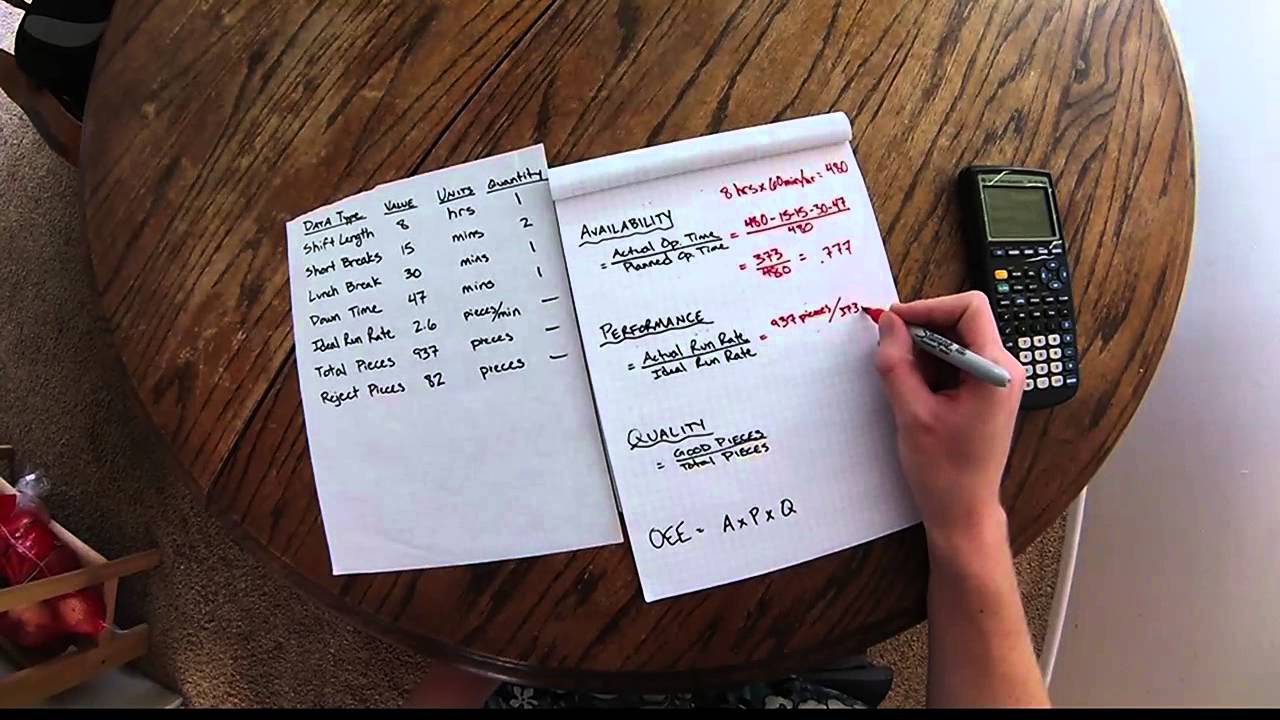
Here is an example of OEE calculation:
Gibbons & Burgess (2010) argue that OEE calculation is outdated and propose expanded OEE framework which incorporates Six Sigma elements and asset management strategy performance indicators.
Although both process cycle efficiency and OEE provide valuable information they are far from enough to provide the bigger picture.
Leanness should not be assessed only in the sense of tools, techniques and practices, but rather as a holistic approach (Husby, 2007; Cocolicchio, 2008).
Measuring leanness
Bhasin (2011) proposed a framework for holistic approach to measurement of leanness, divided 104 indices into twelve categories:
- overall safety, cleanliness and order
- production and operation flow
- process and operations
- visual management
- quality designed into the product
- continuous improvement
- Lean change strategy
- Lean sustainability
- culture – employee oriented
- organisational culture – organisational practices
- Lean treated as a business
- Lean philosophy
Maximum audit score of 1040. After assessment, scores are compared to the table below, and lean stage is identified.
Lean stages, their descriptions and corresponding audit scores:
| Stage | Indicative organisational characteristics | Points |
|---|---|---|
| Planning | No implementation; benefits evident but no infrastructure and no organisational decisions have been implemented | < 155 |
| Developmental | Implementation started; pilot area selected and work commenced; no roll out; few tools with little subsequent commitment; may have been implemented in other areas; importance of culture not recognised | > 156 |
| Mechanical | Pilot progressing well; few tools embedded within internal organisation but largely within manufacturing only; tools are implemented in a piecemeal fashion with little consideration of correlations; importance of culture not recognised | > 312 |
| Enhanced | Pilot proven successful; roll out programme progressing in other key areas within the internal organisation; predominantly manufacturing based; recognition that culture and the organisational practices need addressing but few tangible signs visible towards accomplishing this | > 468 |
| Holistic | Roll-out programme on track; internal organisation nearly incorporated; suppliers embraced and signs towards integration of the whole value chain; organisational and cultural developments still in their infancy | > 624 |
| Innovative | Lean principles applied across the whole internal organisation; good progress towards integrating across the whole value chain; some cultural and organisational development issues fully implemented but further progress required; ingrained as a strategy | > 780 |
| Ideological | Lean tools, culture and organisational practices alongside the ideology implemented across every component of the value chain; recognised as a combination of value streams, Lean viewed as the way of working with a quest for perfection apparent | > 936 |
Benefits of such holistic approach to assessment of leanness is that organisation can relatively easily assess if its actions are supporting lean thinking, and base its future decision on the outcome of the assessment.
Concluding remarks
In this article we covered how to calculate:
- process cycle efficiency, and
- overall equipment effectiveness.
We also looked into measuring organisational leanness.
Measuring right things is important for seeing the true impact of our actions. Nothing is as wasteful as doing the wrong thing faster.
References
Basu, R. (2009). Implementing Six Sigma and Lean: A practical guide to tools and techniques. Elsevier Butterworth-Heinemann.
Bhasin, S. (2011). Measuring the Leanness of an organisation. International Journal of Lean Six Sigma, 2(1), 55–74.
Cocolicchio, B. (2008). Creating your lean future state: How to move from seeing to doing. Quality Progress, 41(1), 88–88.
George, M. (2002). Lean Six Sigma: Combining Six Sigma quality with lean speed. McGraw-Hill.
Gibbons, P. M., & Burgess, S. C. (2010). Introducing OEE as a measure of lean Six Sigma capability. International Journal of Lean Six Sigma, 1(2), 134–156.
Hill, A. (2012). The encyclopedia of operations management: A field manual and glossary of operations management terms and concepts. FT Press.
Hofer, C., Eroglu, C., & Hofer, A. R. (2012). The effect of lean production on financial performance: The mediating role of inventory leanness. International Journal of Production Economics, 138(2), 242–253.
Husby, P. (2007). Becoming lean. Material Handling Management, 62, 42–51.
Little, J. D. C. (1961). A proof for the queuing formula: L= λW. Operations Research, 9(3), 383–387.
Little, J. D. C. (2011). Little’s Law as viewed on its 50th anniversary. Operations Research, 59(3), 536–549.
Schonberger, R. J. (2011). ASP, the art and science of practice: Taking the measure of lean: Efficiency and effectiveness, part I. Interfaces, 41(2), 182–187.
Schonberger, R. J. (2011a). ASP, the art and science of practice: Taking the measure of lean: Efficiency and effectiveness, part II. Interfaces, 41(2), 188–193.
This article is a part of Lean Thinking series:



Bruno Unfiltered
Subscribe to get the latest posts delivered right to your inbox. No spam. Only Bruno.


